

An A1C test can offer reassuring news. The result may be within an individualized target, suggesting that average blood sugar levels have been reasonably controlled over the previous two to three months. But continuous glucose monitoring can tell a more complicated story: overnight lows, sharp post-meal highs, or repeated swings across the day.
This is where the familiar A1C vs blood sugar question becomes clinically important. HbA1c summarizes longer-term glycemic exposure, while CGM shows when glucose rises or falls, how long it remains outside the desired range, and how variable the pattern is. Two patients can therefore have a similar A1C while experiencing very different glucose profiles.
To understand how clinicians interpret these differences, MDForLives surveyed endocrinologists and diabetes specialists across six countries. The findings suggest that HbA1c remains important but increasingly sits within a broader assessment of glucose patterns, hypoglycemia, time in range, and variability. The detailed findings are available in the MDForLives HbA1c and CGM Insight Report.
For clinicians, the practical question is not simply whether HbA1c is at target. It is whether that average reflects a glucose pattern that is also stable and safe.
A good A1C can still hide unstable blood sugar levels
HbA1c is valuable because it condenses weeks of glycemic exposure into one familiar measure. But an average cannot show how that number was produced.
Repeated highs and lows can partially offset each other. A patient may experience post-meal hyperglycemia alongside periods of low glucose overnight or between meals while still recording an HbA1c that appears acceptable.
In the MDForLives survey, 54.2% of respondents said HbA1c remains important but is increasingly interpreted alongside other measures.
The clinical implication is straightforward: average control and stable control are not necessarily the same thing.
An HbA1c within target may therefore be the starting point for interpretation when symptoms, glucose readings, hypoglycemia risk, or treatment response suggest that the average may be masking a more complex pattern.
When A1C vs blood sugar tells two different stories, look at the pattern
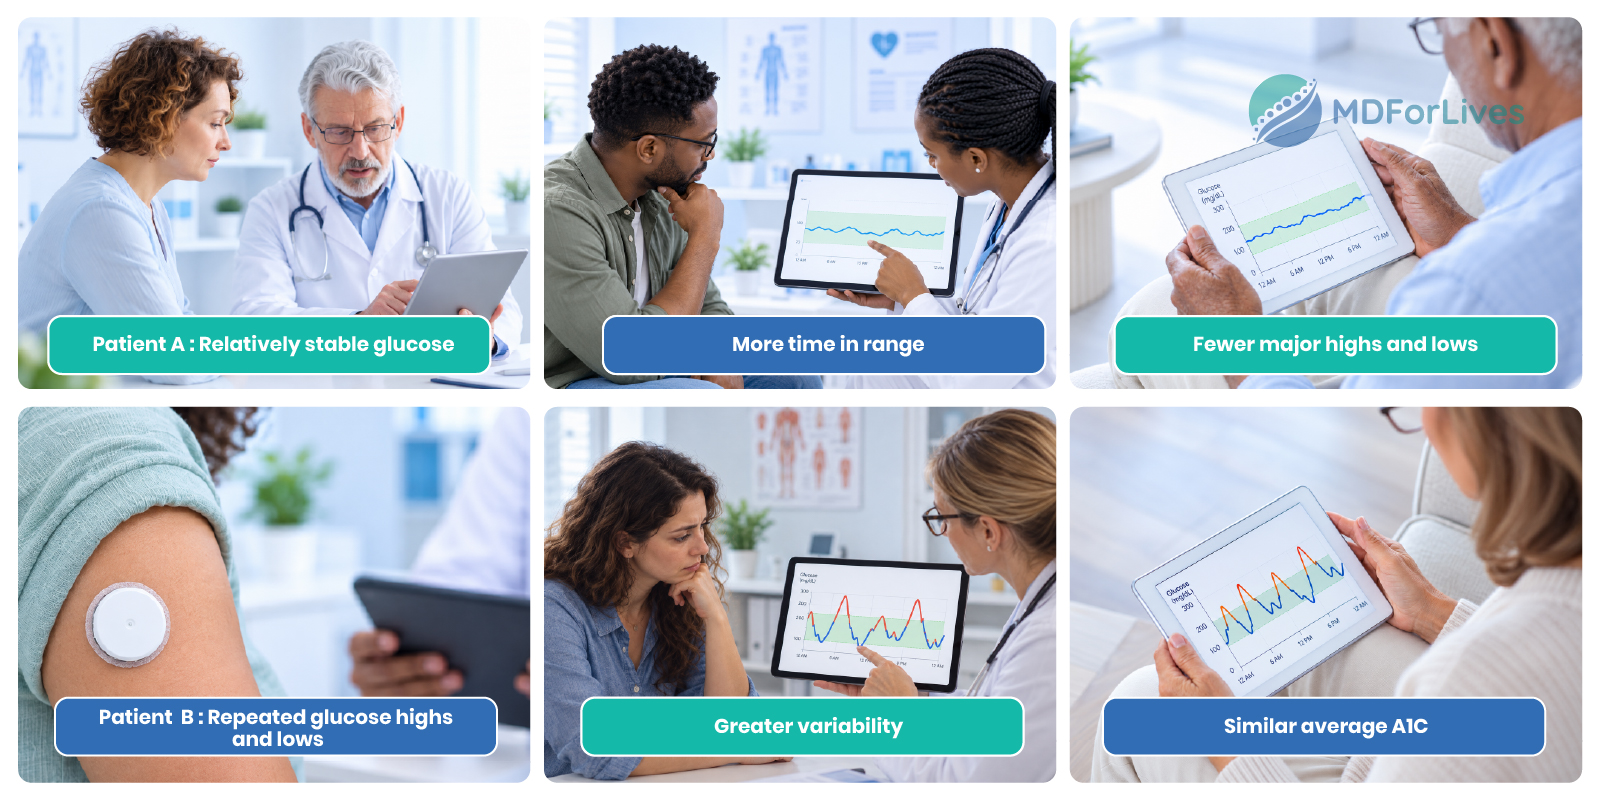
Discordance between HbA1c and CGM should not automatically be treated as conflicting information. The mismatch itself may identify what requires attention.
When HbA1c and CGM-derived measures did not align, 66.1% of surveyed endocrinologists said time in range, time below range, time above range, and broader glucose patterns had the greatest influence on their interpretation.
That shifts the question from “Which number is right?” to “What is producing the difference?”
CGM may reveal recurrent postprandial excursions, previously unrecognized overnight hypoglycemia, or substantial glucose variability. Clinicians may also need to consider whether enough sensor data is available or whether individual clinical factors affect how well HbA1c represents the underlying glucose profile.
The value of discordance is therefore not simply resolving two different numbers. It is identifying a potentially actionable pattern.
CGM time in range helps organize the glucose story
Continuous glucose monitoring provides considerably more information than a single laboratory result. The challenge is to decide which signals deserve attention first.
In the survey, 49.2% of endocrinologists selected CGM time in range (TIR) as the single most clinically actionable CGM-derived measure in routine practice.
TIR summarizes how much monitored time glucose spends within a defined target range, but it should not be interpreted alone. Time below range, time above range, variability, and the timing of recurring excursions provide the context behind the percentage.
A reasonable TIR may still require attention when clinically important hypoglycemia is present. A low TIR may have different implications when driven mainly by post-meal elevations than when accompanied by repeated lows.
The useful role of TIR is therefore to organize the glucose story without replacing the pattern behind it.
Normal A1C but high blood sugar is only one form of hidden risk
The question of normal A1C but high blood sugar often arises when finger-stick readings or CGM appear inconsistent with the laboratory result.
For clinical decision-making, however, “within an individualized target” is generally more useful than simply describing an A1C as normal. High glucose is also the only reason to look beyond an apparently acceptable average.
The MDForLives survey examined a scenario in which HbA1c appeared acceptable, but CGM showed significant variability or hypoglycemia. In that situation, 66.7% of respondents said they were likely to modify treatment based on the CGM findings. Another 26.3% would do so selectively depending on severity and patient context.
The deeper message is that meeting an HbA1c target does not automatically establish that glycemic control is safe or stable.
Recurrent lows, pronounced variability, or recurring high-glucose patterns can change the interpretation even when the laboratory average alone would not trigger a treatment review.
More CGM data should lead to a better decision
The clinical value of CGM becomes clearest when the additional information changes what happens next.
In the survey, 57.9% of endocrinologists said CGM frequently or very frequently leads to treatment changes that would not have been made from HbA1c alone.
Importantly, that does not automatically mean treatment intensification.
A recurring CGM pattern may support changes in treatment timing, greater attention to post-meal exposure, reconsideration of basal therapy, reduction of hypoglycemia risk, patient education, or further monitoring before a larger adjustment.
Diabetes monitoring is increasingly moving beyond isolated glucose readings toward tools that can reveal patterns and support more informed decisions. Explore how newer diabetes tools are reducing the daily burden.
This matters because a numerically lower glucose profile is not necessarily better if achieving it increases clinically meaningful hypoglycemia or treatment burden.
CGM should therefore help clinicians distinguish between a number that can be improved and a pattern that needs intervention.
HbA1c and CGM answer different questions, and that is their strength
The growing role of CGM does not turn glycemic assessment into a competition between two measures.
HbA1c provides a longer-term view of glycemic exposure. CGM adds timing, direction, range, variability, and visibility into events that an average cannot display.
Together, they can distinguish an acceptable average produced by relatively stable glucose from the same average produced by repeated highs and lows.
In the MDForLives survey, 61.4% of respondents identified wider CGM use and greater integration of TIR, TBR, and TAR with HbA1c as the development most likely to change glycemic assessment over the next two to three years.
The next step may therefore be less about finding another single measure and more about making the average and daily pattern easier to interpret together.
Closing perspective: looking beyond the average
An A1C that looks good can still be only part of the diabetes-control story.
HbA1c remains valuable because it provides a longer-term measure of glycemic exposure. CGM complements that view by showing what happens within the average: when blood sugar levels rise, when they fall, how much time is spent inside or outside range, and whether clinically important variability is present.
Managing diabetes involves more than looking at a single glucose measure. Ongoing monitoring, treatment decisions, and daily self-management all shape how patients experience the condition. Explore living with diabetes and staying healthy.
The MDForLives findings suggest that endocrinologists are increasingly using those differences as an actionable clinical context. When HbA1c and CGM disagree, the task is not simply to choose one measure over the other. It is to understand what the glucose pattern adds to the interpretation.
The more useful question may therefore not be A1C or CGM?
It is whether the average and the pattern, viewed together, provide a more complete picture of glycemic control for the individual patient.